Modalidad
Online
Duración - Créditos
200 horas
Becas y
Financiación
Plataforma Web
24 Horas
Centro Líder
formación online
Acompañamiento
Personalizado
Reconocidos por:

Acreditados como:
Temario
UNIT 1. INTRODUCTION TO DATA VISUALIZATION
UNIT 2. TABLEAU
UNIT 3. D3 (DATA DRIVEN DOCUMENTS)
UNIT 4. LOOKER STUDIO (GOOGLE DATA STUDIO)
UNIT 5. QLIKVIEW
UNIT 6. POWER BI
UNIT 7. CARTO
Plan de estudios


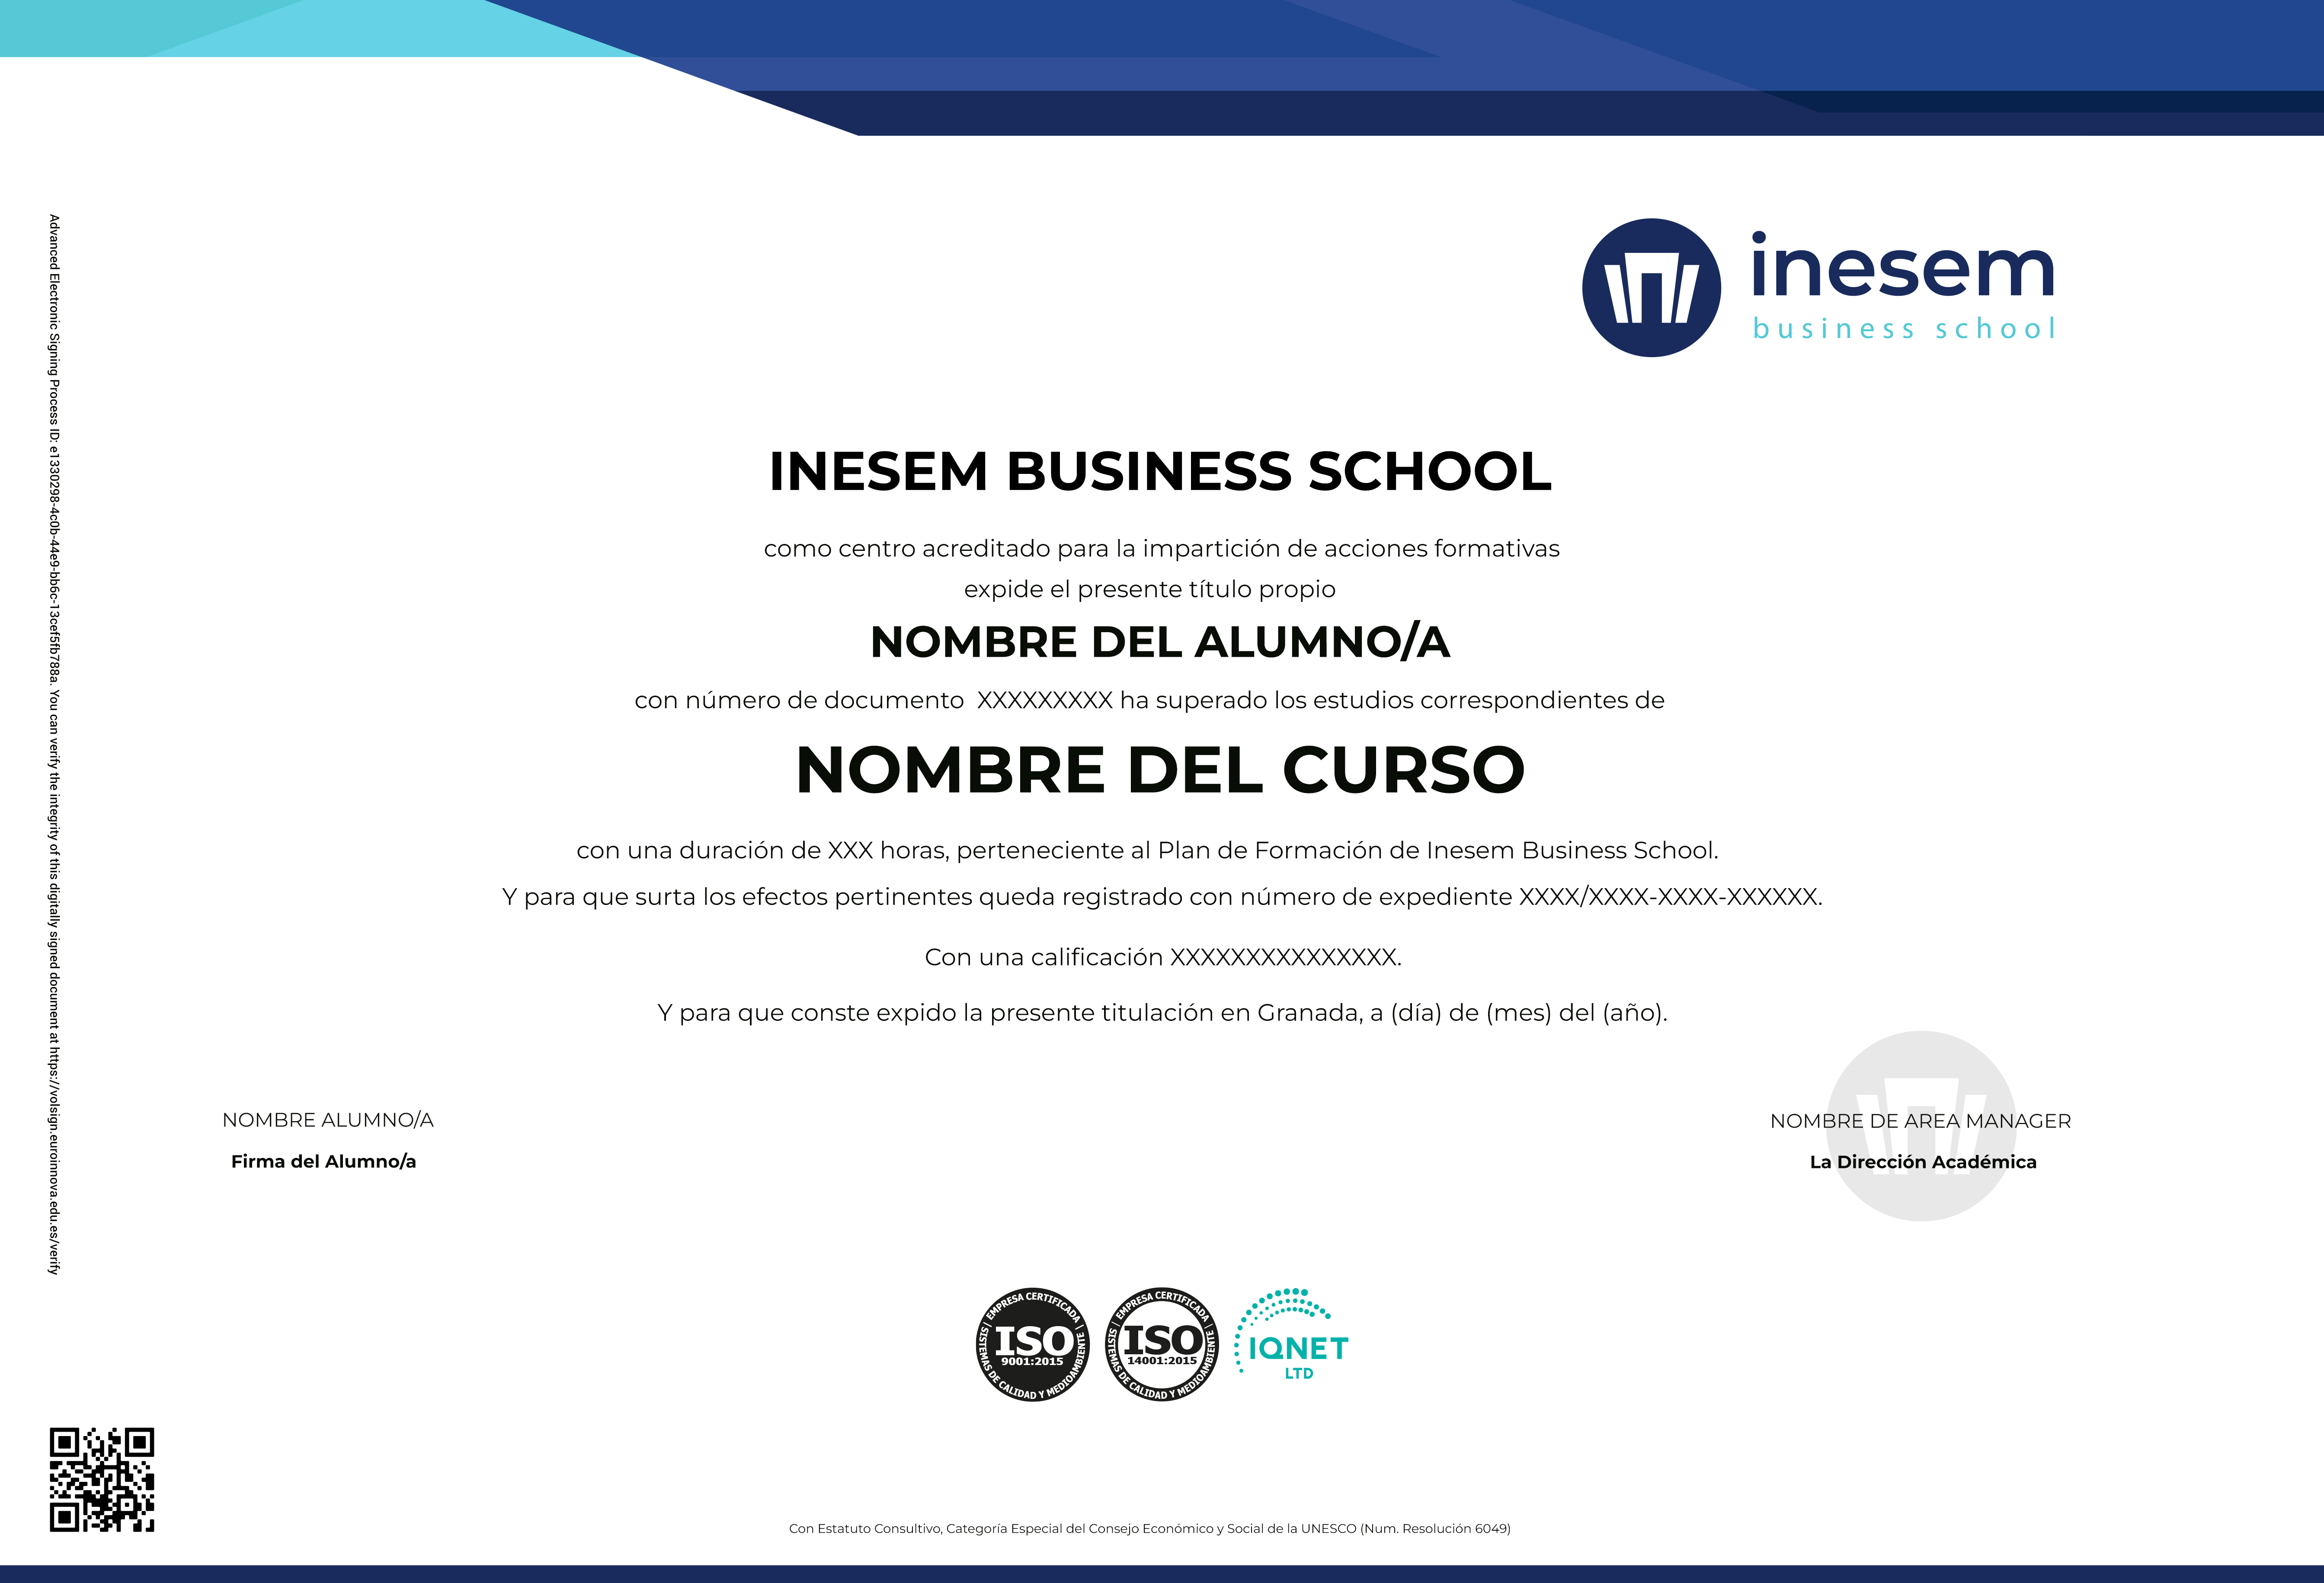
Titulación de course introduction to data visualization


Descubre todas nuestras becas personalizadas

Course Introduction To Data Visualization
Would you like to boost your career with new tools? Do you think you could improve your skills in the field of Data Visualization? Are you interested in adapting to the current job market demands and obtaining the training that companies are looking for in their teams? If you want to achieve any of your goals, this Course Introduction to Data Visualization is the perfect opportunity to do so. Thanks to Euroinnova's e-learning methodology, you will be able to acquire quality knowledge in the most flexible and convenient way imaginable.
Still undecided? We invite you to continue reading

Request the information you need from Euroinnova International Online Education!
What is Data Visualization and why should you take a course in it?
Data Visualization is a process by which reports and documents from a specific society, company, or industry sector are interpreted in such a way that different methodologies are applied to make the reading more timely and achieve a specific goal. Data Visualization is not just about understanding the report itself; it involves representing data with graphs and other tools, thus allowing the discovery of different patterns, trends, or useful insights for the knowledge of a company.
With this type of report, a company is able to monitor, assess, and later control its sales, investments, etc. Thanks to Data Visualization, it will understand the workings of its internal system, allowing it to modify any unfavorable patterns. Furthermore, through various software and tools, multiple elements or raw data can be processed. This kind of training is highly useful for almost any business sector since the information that can be collected is diverse and aimed at various purposes.
What benefits can the Course Introduction to Data Visualization offer you at Euroinnova International Online Education?
Technology has made a huge impact in our lives today. Its footprint is so profound that it has even affected how we live, work, and interact with others. As a result, many changes are occurring in work processes, generating new job opportunities and professions. For instance, thanks to Globalization, we now have access to other realities and languages, making it necessary to learn a second language in almost all curriculum requirements. Similarly, physical libraries have transferred all their cultural content to digital platforms, allowing us to access manuals, scientific journals, and other readings with just a click from home.
Extrapolating these changes to Data Visualization, we can see that businesses are now structured around the collection and analysis of data related to their products and sales. Therefore, having professionals specialized in these functions is a guarantee of success for any business. Thus, taking a Diploma in Data Analysis is not just a personal win for the quality knowledge it provides, but also a career boost as it offers up-to-date training tailored to the current job market's needs, helping to create a more attractive CV.
With the Diploma in Data Visualization, you will learn how to work with information from various databases, both relational and non-relational. You will also use ETL processes and work with two of the most cutting-edge programming languages, Python and R. Additionally, you will have a team of professionals specialized in the subject. Ultimately, with the Diploma in Data Analysis, you will be able to understand data science and the necessary tools for a data scientist. You will also develop the ability to manage relational databases using the SQL query language, specifically MySQL.
Why enroll in the Course Introduction to Data Visualization offered by Euroinnova International Online Education?
Take advantage of the opportunity offered by Euroinnova International Online Education to expand your knowledge. With the Diploma in Data Visualization, you will be able to combine work and personal life in the most convenient way possible.
Euroinnova's methodology is based on distance learning, so you can study from anywhere in the world. Whether you live in Nuevo León, Jalisco, Guadalajara, Sonora, Baja California, Yucatán, CDMX, Guerrero, Chiapas, or Peru, it doesn't matter. Additionally, you will have a personalized tutor available to answer your questions or doubts within 24-48 hours.
If you're still unsure, feel free to contact us through our form. Get started and take advantage of the benefits of Euroinnova's Online Training!

¡Muchas gracias!
Hemos recibido correctamente tus datos. En breve nos pondremos en contacto contigo.


